Many observers say that democracy has undergone a large-scale global decline in recent decades. However, different ways to present the evidence lead to different conclusions. This calls for increased caution and reflection among those discussing democratic trends, writes Svend-Erik Skaaning
In several countries, including Venezuela, Turkey, India, Côte d’Ivoire, and Hungary, elected rulers have undermined democracy. Some have even succeeded in passing the threshold of dictatorship. Meanwhile, military rule has recently replaced democracy in Burkina Faso, Myanmar, and Mali. The Russian invasion of Ukraine shows us, too, that democracy remains under threat from external enemies.
Present-day assaults on democratic institutions are real. However, to what extent are they representative of overall trends?
These assaults on democratic institutions are real. However, to what extent are they representative? Does the perspective we take influence our interpretation of global trends? Does it make a difference if we are inspired by Schumpeter to apply electoral democracy as the background concept, or by Dahl to use the 'thicker' polyarchy? Should we emphasise the number, or the share, of democracies? Do we understand democracy as a binary phenomenon, based on the LIED v6.4 categorical distinctions? Or should we understand it as a continuous phenomenon, based on the V-Dem v12 continuous Electoral Democracy Index? And finally, are the revealed trends dependent on whether our account refers to countries, or to the number, or share, of global citizens?
Three findings, based on ten different combinations of these perspectives (see the graphs below), deserve special attention.
First, the world has never been more democratic than in the 2010s. This conclusion applies no matter what procedure we employ to present the evidence. All the maximum values regarding the global spread of democracy fall between 2012 and 2018. This indicates that the recent downturn began later than many observers suggest.
Second, there is noteworthy disagreement about the magnitude of democratic decline after it reached its high point. Seven of the ten perspectives reveal negative changes between 4% and 10%, which hardly makes for a major democratic recession. Moreover, these indicate that the world is still much more democratic today than in both 1974, the beginning of the third wave of democratisation according to Huntington, and 1989, when the wave of democratisation gained additional momentum with the breakdown of communist regimes in Eastern Europe.
The world has never been more democratic than in the 2010s. However, perspectives disagree on the trajectory of change since then
That said, one perspective identifies an 18% decline, and two a decline of more than 50% compared to maximum levels. These perspectives even suggest that the global state of democracy has hardly improved – or has even worsened substantively – compared to 1974 and 1989.
Third, the most dismal accounts are based on population-weighted procedures using measures of polyarchy. The large declines these capture are caused mainly by democratic backsliding in a single country: India. Other perspectives, focusing on countries rather than citizens, or capturing developments in electoral democracy, tell a different story.
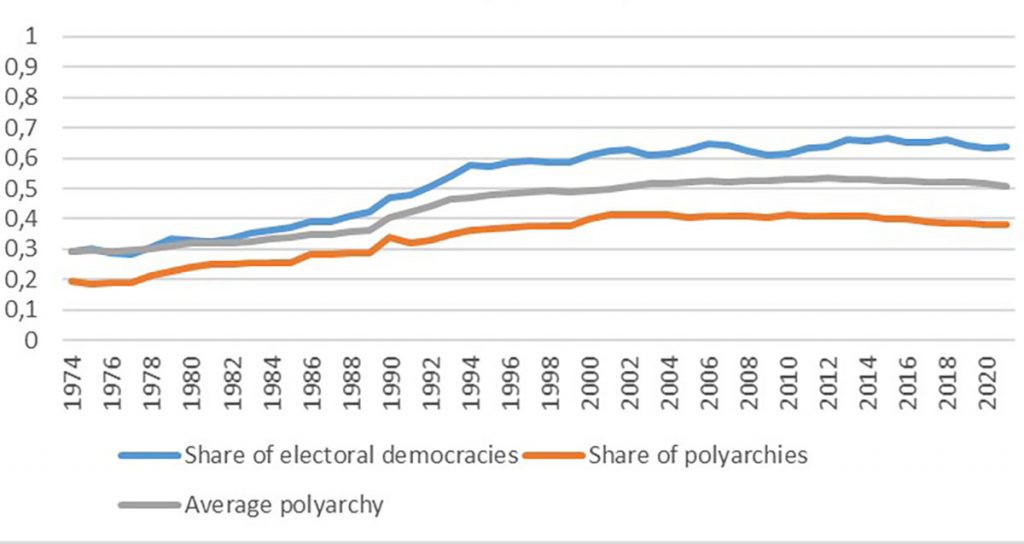
The first graph plots overall trends between 1974 and 2021. It shows that these trends are not so dependent on whether one focuses on the global average or the share of (at least) electoral democracies and polyarchies, respectively. The global average has not changed much in the last two decades. Also, the global shares of electoral democracies and polyarchies have not decreased substantively.
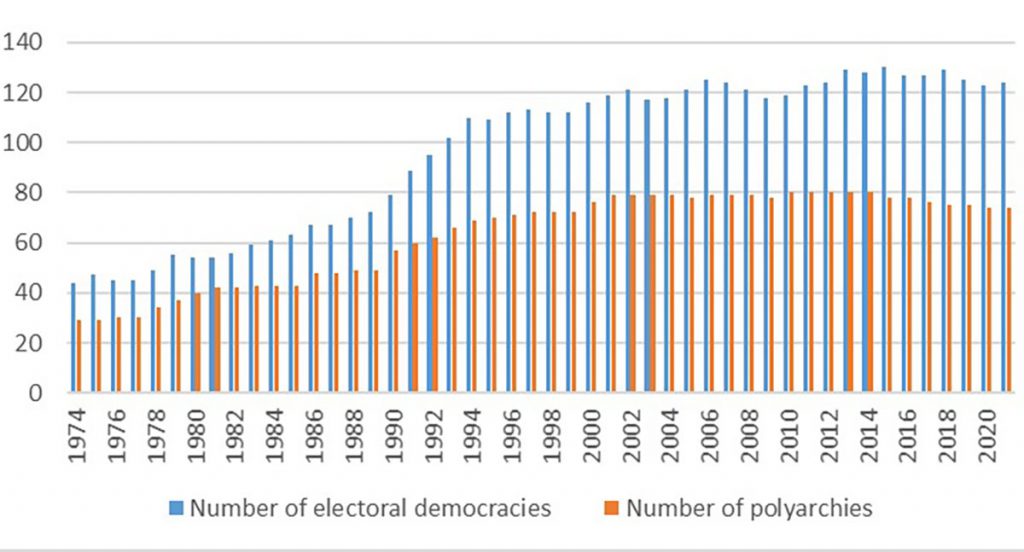
Turning the focus from relative shares to the absolute number of countries, the graph below indicates overall democratic stability rather than extensive decline in the new millennium. The number of electoral democracies, characterised by free and regular elections for political power, peaked in 2015. However, it has not changed much since 2000. Meanwhile, the number of polyarchies, which add effectively enforced freedom of speech and association to the electoral criteria, has also been relatively stable in this period – within the range of 74 to 80.
What tendencies are revealed if we change the focus to the global citizen level? Below we see that the discrepancy with country-level accounts is relatively small when we look at the share of the global population living in minimalist democracies. The divergence is greater, however, regarding polyarchies. The share fluctuated mildly between 38% and 40% in the years from 1990 to 2017, before a sudden extreme decline in 2018.
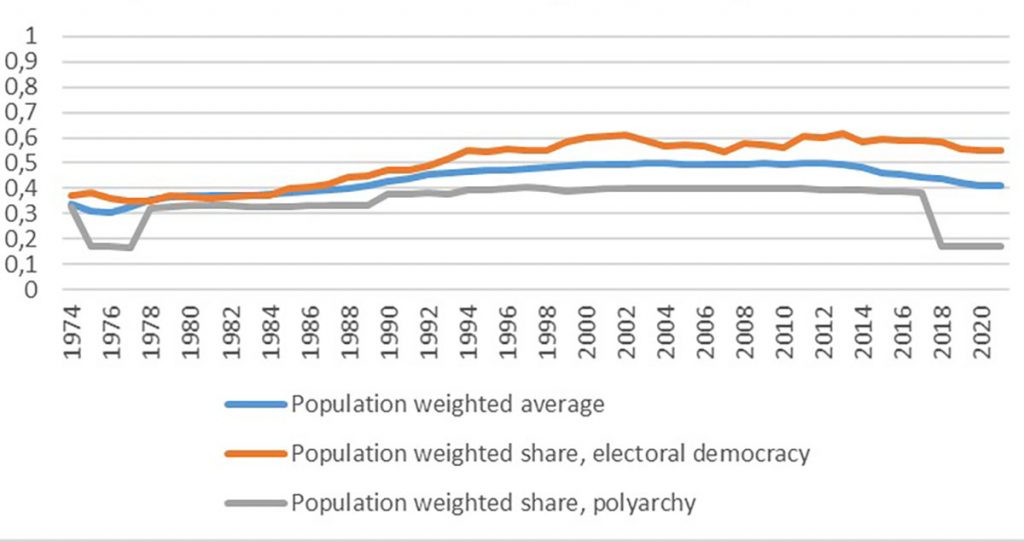
We can attribute this abrupt decay almost exclusively to the fact that India moved out of the set of polyarchies when its national BJP government introduced obstacles to free speech and civil society. A similar downturn happened in 1975 following Indira Gandhi’s declaration of a state of emergency. India’s current constraints on freedom of expression and freedom of association have also had a strong negative impact on the population-weighted average. This average has fallen from .5 in 2012 to .41 in 2021.
Whether we draw attention to relative or absolute numbers can also influence the trend when we use global citizens as the unit of analysis. Even if the population-weighted share of democracies decreases, the number of people living in democracies could still be increasing because of population growth.
Indeed, the number people living in electoral democracies has been increasing almost continuously. In 1974, it stood at around 1.47 billion. In 2021, it was 4.22 billion, down from a maximum of 4.44 billion in 2018.
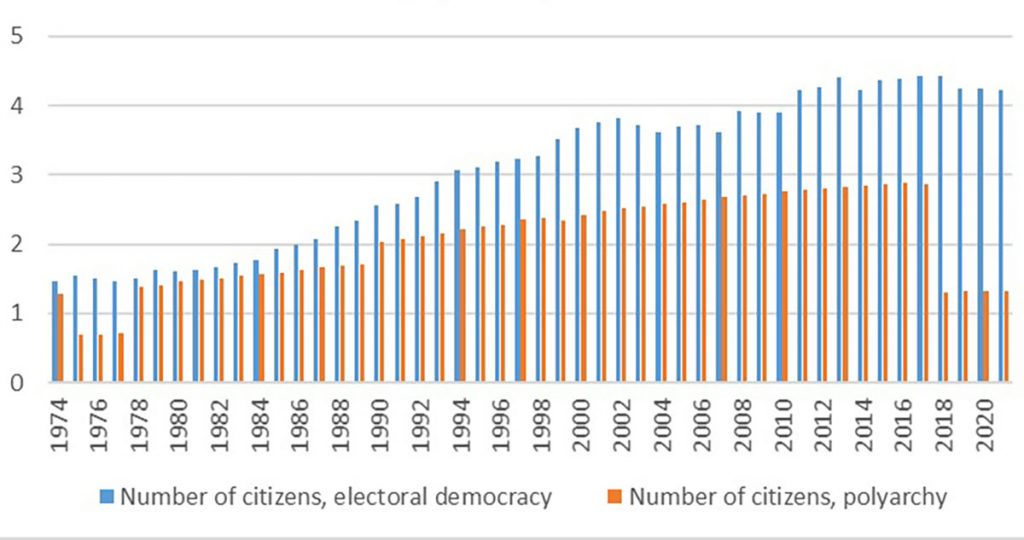
The total number of citizens living in polyarchies has also increased steadily, with two exceptions. These are both the result of India’s status changes in 1975 and 2018 mentioned above.
This final figure summarises the findings based on the different accounts. It shows how much the numbers for 2021 differ from 1974, 1989, and the most recent year the global maximum value was achieved.
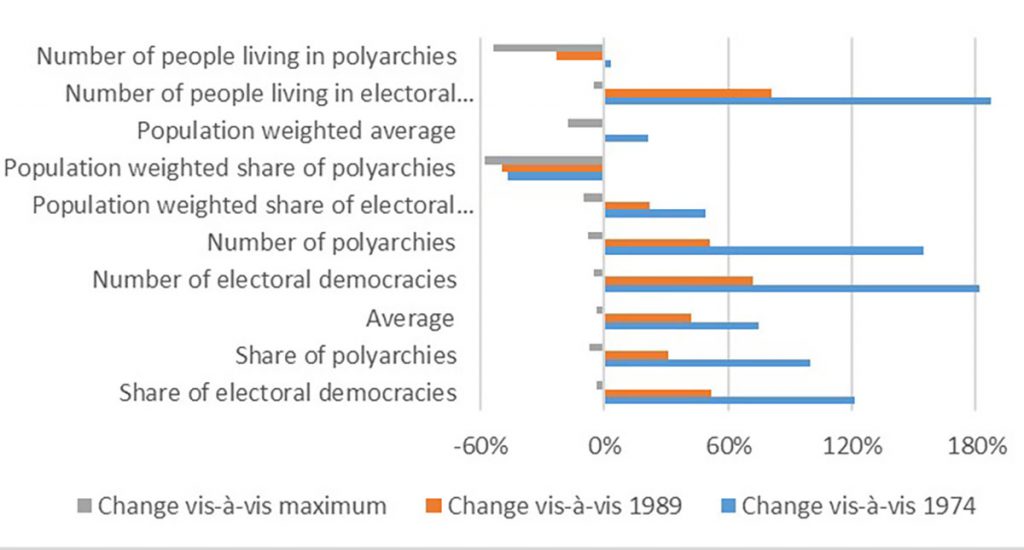
Some of the accounts produce quite similar trends for 1974–2021. But it is important to note that this would not be the case if we extended the analysis further back in time. Taken together, a closer inspection of the results indicates that sweeping statements about democratic decline need to be grounded in conscious and balanced discussions of trends that take different perspectives into account.
Svend-Erik's research interests include the conceptualisation, measurement, and explanation of democracy and other issues related to good governance.
He is project manager (previously co-PI) of Varieties of Democracy (V-Dem).
Democracy
Johns Hopkins University Press, 2022
Democratic Stability in an Age of Crisis: Reassessing the Interwar Period
Oxford University Press, 2020
Varieties of Democracy: Measuring Two Centuries of Political Change
Cambridge University Press, 2020

